Note
If you are experiencing graphics glitches, unreadable text, or the desktop color scheme you have set up is not suitable for Qtenv, you can disable the platform integration style plugins of Qt by setting theQT_STYLE_OVERRIDE environment variable
to fusion. This will make the widgets appear in a platform-independent manner, as shown above.
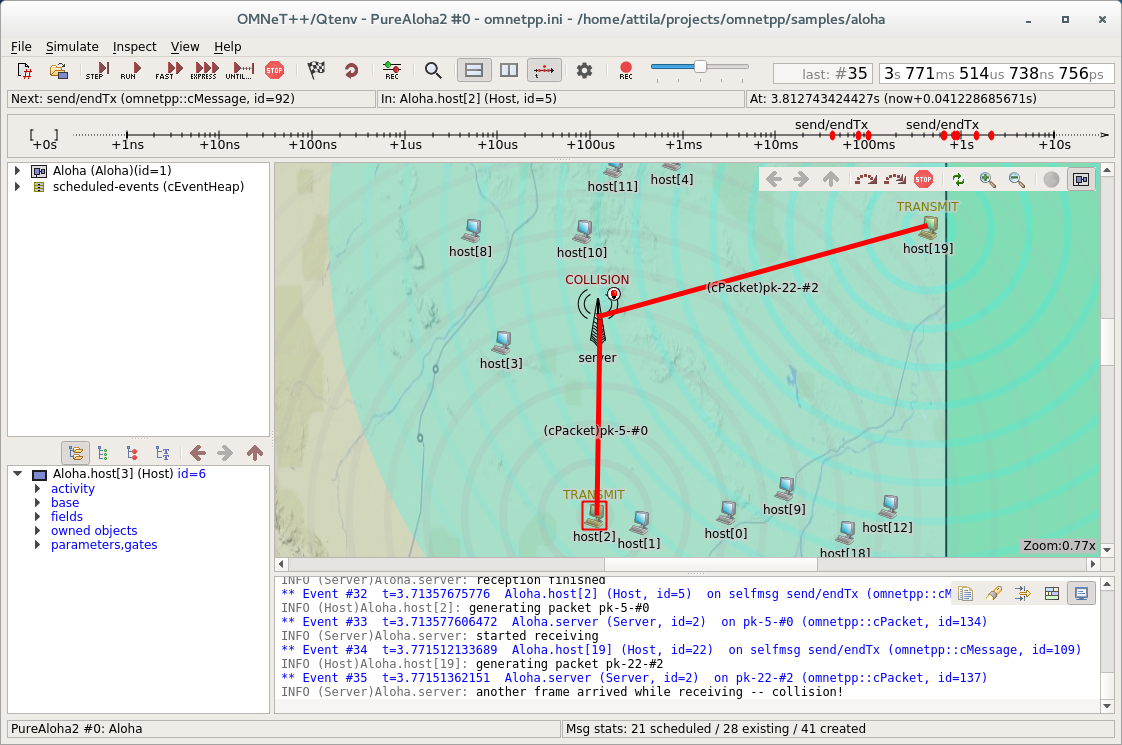
The top of the window contains the following elements below the menu bar:
- Toolbar: The toolbar lets you access the most frequently used functions, such as stepping, running and stopping the simulation.
- Animation speed: The slider on the end of the toolbar lets you scale the speed of the built-in animations, as well as the playback speed of the custom animations added by the model.
- Event Number and Simulation Time: These two labels on the right end of the toolbar display the event number of the last executed or the next future event, and the current simulation time. The display format can be changed from context menu.
- Top status bar: Three labels in a row that display either information about the next simulation event (in Step and Normal mode), or performance data like the number of events processed per second (in Fast and Express mode). This can be hidden to free up vertical space.
- Timeline: Displays the contents of the Future Events Set (FES) on a logarithmic time scale. The timeline can be turned off to free up vertical space.
- Bottom status bar: Displays the current configuration, the run number, and the name of the root module (network) on the left, and a few statistics about the message objects in the model on the right.
The central area of the main window is divided into the following regions:
- Object Navigator: Displays the hierarchy of objects in the current simulation and in the FES.
- Object Inspector: Displays the contents and properties of the selected object.
- Network Display: Displays the network or any module graphically. This is also where animation takes place.
- Log Viewer: Displays the log of packets or messages sent between modules, or log messages output by modules during simulation.
Additionally, you can open inspector windows that float on top of the main window.