The status bars show the simulation's progress. There is one row at the top of the main window, and one at the bottom. The top one can be hidden using the View | Status Details menu item.

When the simulation is paused or runs with animation, the top row displays the next expected simulation event. Note the word expected: certain schedulers may insert new events before the displayed event in the last moment. Some schedulers that tend to do that are those that accept input from outside sources: real-time scheduler, hybrid or hardware-in-the-loop schedulers, parallel simulation schedulers, etc. Contents of the top row:
- Name, C++ class and ID of the next message (event) object
- The module where the next event will occur (i.e. the module where the message will be delivered)
- The simulation time of the next (expected) simulation event
- Time of the next event, and delta from the current simulation time
When the simulation is running in Fast or Express mode, displaying the next event becomes useless, so the contents of the top row are replaced by the following performance gauges:

- Simulation speed: number of events processed per real second
- Relative speed of the simulation (compared to real-time)
- Event density: the number of events per simulated seconds
The bottom row contains the following items:

- Ini config name, run number, and the name of the network
- Message statistics: the number of messages currently scheduled (i.e. in the FES);
the number of message objects that currently exists in the simulation; and the
number of message objects that have been created this far, including the
already deleted ones. Out of the three, probably the middle one is the most useful:
if it is steadily growing without apparent reason, the simulation model is probably
missing some
delete msgstatements, and needs to be debugged.

The timeline displays the contents of the Future Events Set on a logarithmic time scale. Each dot represents a message (event). Messages to be delivered in the current simulation time are grouped into a separate section on the left between brackets.
Clicking an event will focus it in the Object Inspector, and double-clicking will open a floating inspector window. Right-clicking will bring up a context menu with further actions.
The timeline is often crowded, limiting its usefulness. To overcome this, you can hide uninteresting events from the timeline: right-click the event, and choose Exclude Messages Like 'x' From Animation from the context menu. This will hide events with similar name and the same C++ class name from the timeline, and also skip the animation when such messages are sent from one module to another. You can view and edit the list of excluded messages on the Filtering page of the Preferences dialog. (Tip: the timeline context menu provides a shortcut to that dialog).
The whole timeline can be hidden (and revealed again) using the View | Timeline menu item, by pressing a button on the toolbar, or simply by dragging the handle of the separator under it all the way up.
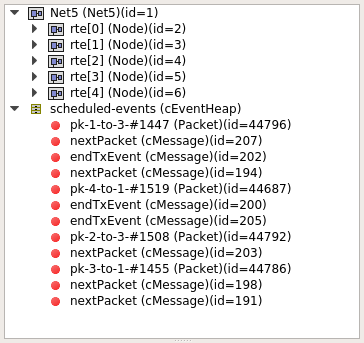
The Object Navigator displays inspectable objects reachable from two root objects (the network module and the FES) in a tree form.
Clicking an object will focus it in the Object Inspector, and double-clicking will open a floating inspector window. Right-clicking will bring up a context menu with further actions.
The Object Inspector is located below the Object Navigator, and lets you examine the contents of objects in detail. The Object Inspector always focuses on the object last clicked (or otherwise selected) on the Qtenv UI. It can be directly navigated as well, via the Back, Forward, and Go to Parent buttons, and also by double-clicking objects shown inside the inspector's area.
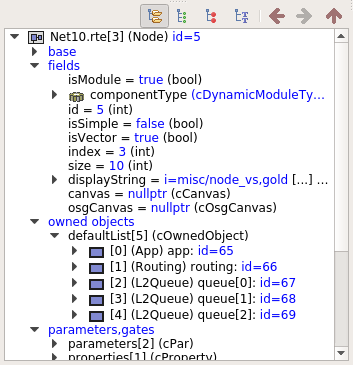
The inspector has four display modes: Grouped, Flat, Children and Inheritance. You can switch between these modes using the buttons on the inspector's toolbar.
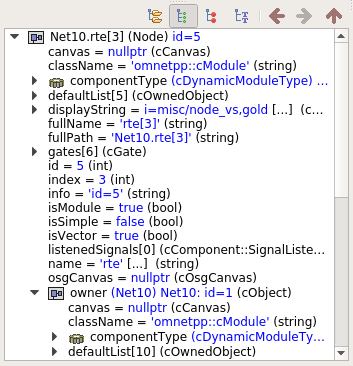
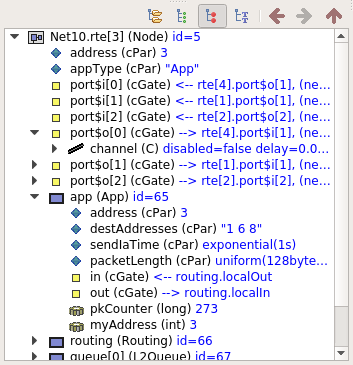
In Grouped, Flat and Inheritance modes, the tree shows the fields (or data members) of the object. It uses meta-information generated by the message compiler to obtain the list of fields and their values. (This is true even for the built-in classes -- the simulation kernel contains their description of msg format.)
The only difference between these three modes is the way the fields are arranged. In Grouped mode, they are organized in categories, in Flat mode they form a simple alphabetical list, and in Inheritance mode they are organized based on which superclass they are inherited from.
|
|
|
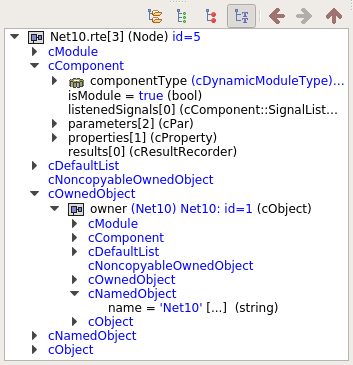
In Children mode, the tree shows the child objects of the currently inspected object.
The child list is obtained via the forEachChild() method of the object.
This is very similar to how the Object Navigator works, but this can have an arbitrary root.
The network view provides a graphical view of the network and in general, modules.
Graphical representation is based on display strings (@display properties in the
NED file). You can go into any compound module by double-clicking its icon.
Message sending, method calls and certain other events are animated in the graphical view. You can customize animation in the Animation page of the Preferences dialog.
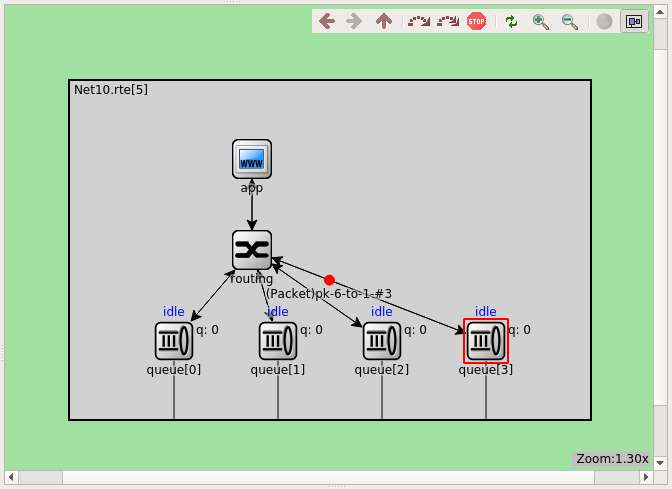
The built-in cCanvas of the inspected object is also rendered in this view together
with the module contents to allow for overlaying custom annotations and animations.
This canvas contains the figures declared by the @figure properties in the NED source of the module.
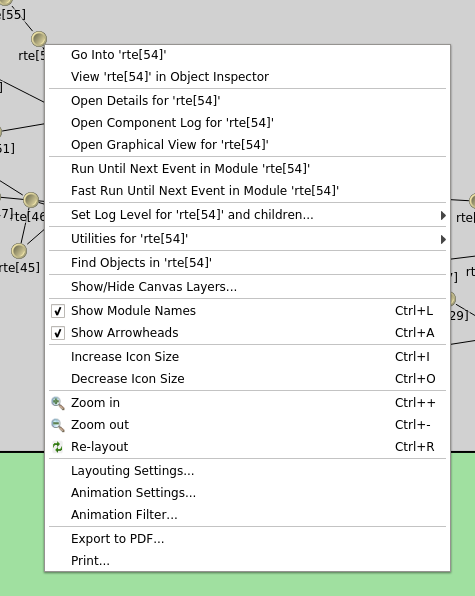
By choosing the Show/Hide Canvas Layers item in the context menu of the inspected module, the displayed figures can be filtered based on the tags set on them.
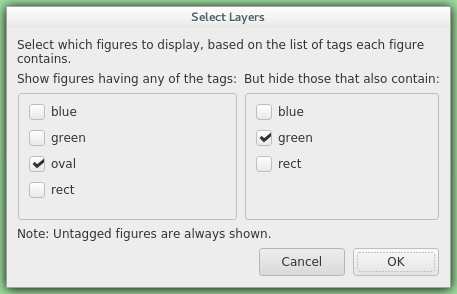
Since any figure can have any number of tags, a two-step filtering mechanism is applied to give sufficient control. The left side is a whitelist, while the right side is a blacklist. The example above would only let all the figures with the "oval" tag appear, except those that also have the "green" tag on them.
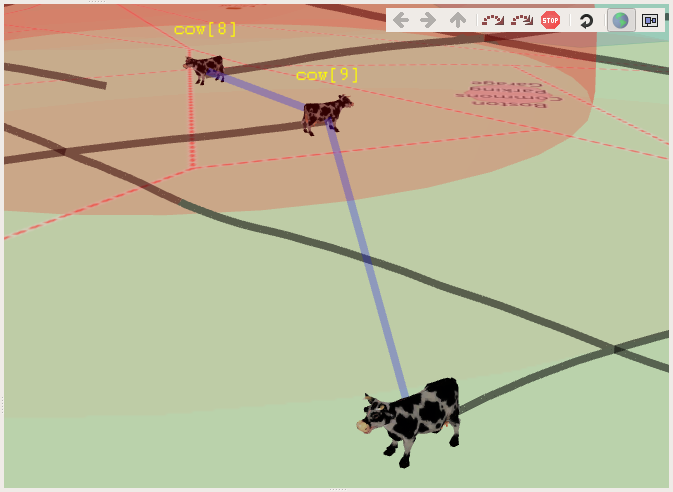
If the inspected module has a built-in cOsgCanvas (and Qtenv is built with OSG support enabled),
this inspector can also be switched into a 3D display mode with the globe icon on its toolbar. In this
case, the 2D network and canvas display is replaced by the scene encapsulated by the cOsgCanvas.
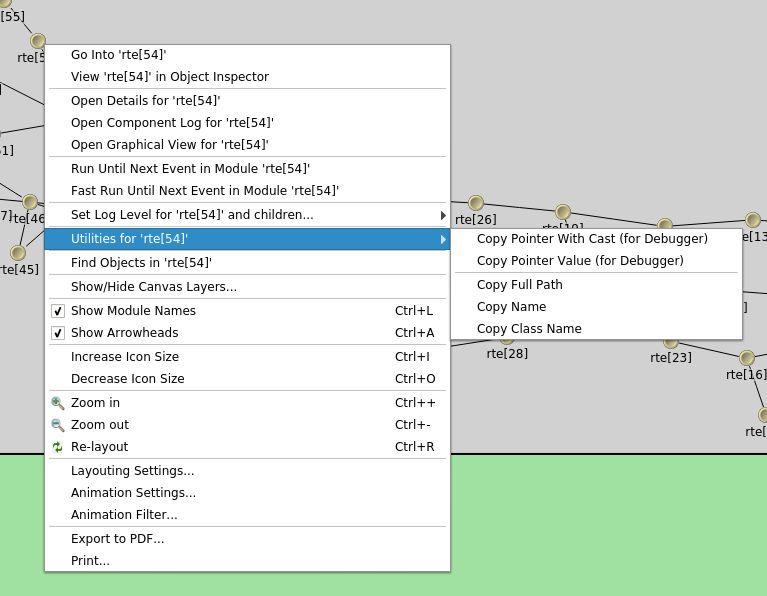
The context menu of submodules makes further actions available (see below).
There are several ways for zooming the canvas, both using the mouse and the keyboard:
To zoom in around a point, double-click the canvas; use Shift + double-click to zoom out, or scroll while holding down Ctrl.
You can also zoom around the center of the viewport with the looking glass buttons on the canvas toolbar.For marquee zoom, drag out a rectangle with the left mouse button while holding down Ctrl; you can cancel the operation with the right mouse button.
Panning: moving the mouse while holding down the left mouse button will move the canvas; this is often a more comfortable way to navigate the canvas than using the scroll bars. You can of course scroll in any direction with simply the mouse wheel, or the similar functionality of many touchpads.
When you run the simulation, Qtenv will remember the output from logging statements
(EV << "Hello World\n";) and the messages sent between modules, and can present
it to you in a meaningful manner. Only the output from the last N events is preserved
(N being configurable in the Preferences dialog), and only in Step, Run and Fast Run
modes. (Express mode can be so fast because such overhead is turned off while it's active.)
The Log Viewer shows log related to one compound module and its subtree. It has two modes: Messages and Log mode, the default being Messages. You can switch between the two modes with tool icons on the inspector's local toolbar.
In Messages mode, the window displays messages sent between the (immediate) submodules of the inspected compound module, and messages sent out of, or into the compound module. The embedded Log Viewer shows content related to the module inspected in the Network Display above it at any time. You can view details about any message in the Object Inspector by clicking on it, and access additional functions in its context menu.
Note
In Messages mode, the Info column can be customized by writing and registering a customcMessagePrinter class. This string is split at the tab characters ('\t')
into parts that are aligned in additional columns.
In Log mode, the window displays log lines that belong to submodules under the inspected compound module (i.e. the whole module subtree.)
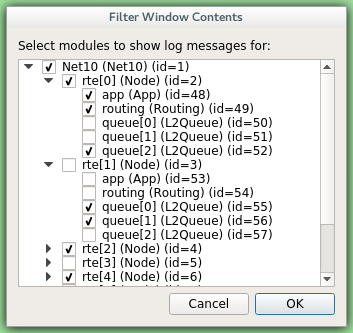
You can filter the content of the window to only include messages from specific modules. Open the log window's context menu and select Filter Window Contents.
General logging behavior, such as the prefix format, can be controlled in the Preferences dialog. The log level of each module (and its descendants) can be set in its context menu.
It is also possible to open separate log windows for individual modules. A log window for a compound module displays the log from all of its submodule tree. To open a log window, find the module in the module tree or the network display, right-click it and choose Open Component Log from the context menu.