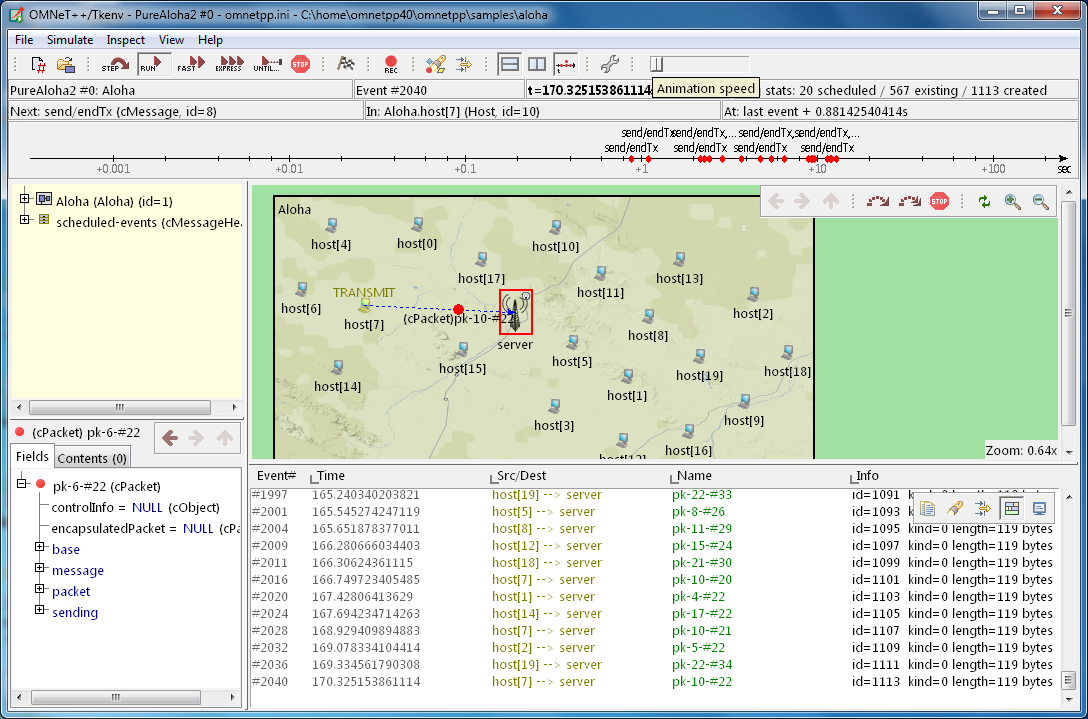
The top of the window contains the following elements below the menu bar:
- Toolbar: The toolbar lets you access the most frequently used functions, such as stepping, running and stopping the simulation.
- Status bar: Two rows of various fields and gauges, displaying the current event number, simulation time, information about the next simulation event, and other details. When the simulation is running, it displays performance data like the number of events processed per second. The second row can be turned off to free up vertical space.
- Timeline: Displays the contents of the Future Events Set (FES) on a logarithmic time scale. The timeline can be turned off to free up vertical space.
The main window is divided into the following areas:
- Object Navigator: Displays the hierarchy of objects in the current simulation and in the FES.
- Object Inspector: Displays the contents and properties of the selected object.
- Network Display: Displays the network or any module graphically. This is also where animation takes place.
- Log Viewer: Displays the log of packets or messages sent between modules, or log messages output by modules during simulation.
Additionally, you can open inspector windows that float on top of the main window.