This section describes the Eventlog Table in details focusing on its features without a particular example.
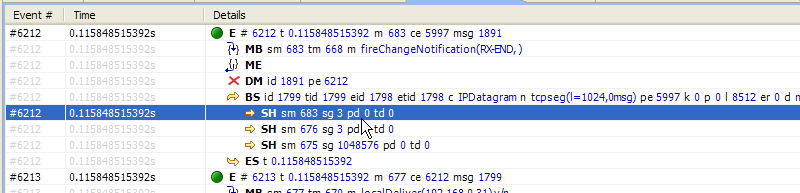
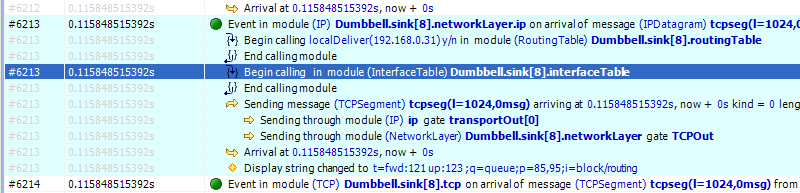
The Eventlog Table has one row per line in the eventlog file. It has three columns. The first two are called event number and simulation time respectively. They show the values corresponding to the simulation event where the line was recorded. The third column, called details, contains the actual data, which varies for each line kind. The different kinds of lines can be easily recognized by their icons. Some lines, such as sending a message through a sequence of gates, relate to each other and are indented so that the user can recognize them more easily.
There are various options, which control how and what the Eventlog Table displays. Some of these are available on the toolbar, while others are accessible only from the context menu.
The eventlog file content may be displayed in two different notations. The Raw data notation shows exactly what is present in the file.
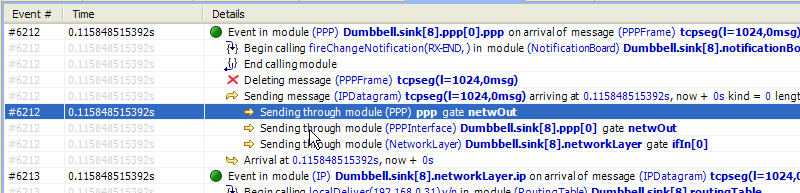
The Descriptive notation, after some preprocessing, displays the log
file in a readable format. It also resolves
references and types, so that less navigation is required to understand what is
going on. To switch between the two, use the Display Mode
![]() button on the toolbar or the context menu.
button on the toolbar or the context menu.
There are three different ways to display names in the Eventlog Table; it is
configurable with the Name Mode ![]() option. Full path and full name shows what you would expect. The smart mode uses
the context of the line to decide whether a full path or a full name should
be displayed. For each event line, this mode always displays the full path. For all
other lines, if the name is the same as the enclosing event's module name, then it
shows the full name only. This choice makes lines shorter and allows for faster
reading.
option. Full path and full name shows what you would expect. The smart mode uses
the context of the line to decide whether a full path or a full name should
be displayed. For each event line, this mode always displays the full path. For all
other lines, if the name is the same as the enclosing event's module name, then it
shows the full name only. This choice makes lines shorter and allows for faster
reading.
The option called Type Mode can be used to switch between displaying the C++ class name or the NED type name in parenthesis before module names. This is rarely used, so it is only available from the context menu.
The Eventlog Table may be filtered by using the Line Filter
![]() button on the toolbar. This option allows
filtering for lines with specific kinds. There are some predefined filters.
button on the toolbar. This option allows
filtering for lines with specific kinds. There are some predefined filters.
You can also provide a custom filter pattern, referring to fields present in Raw mode, using a match expression. The following example is a custom filter, which will show message sends where the message's class is AirFrame.
BS and c(AirFrame)
Please refer to the OMNeT++ Manual for more details on match expressions.
Note
To avoid confusion, event lines marked with green circlesYou can navigate using your keyboard and mouse just like in any other table. There are a couple of non-standard navigation options in the context menu, which can also be used with the keyboard.
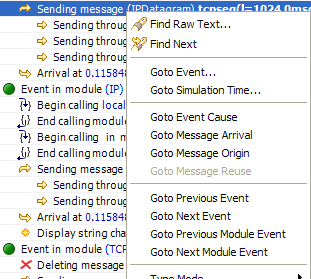
The simplest are the Goto Event and the Goto Simulation Time, both of which simply jump to the designated location.
There are navigation options for going to the previous (Alt+UP) or next (Alt+DOWN) event in general, and to go to the previous (Shift+UP) or next (Shift+DOWN) event in the same module.
Some of the navigation options focus on the causes of events and consequences of message sends. To go to the cause event, press Ctrl+UP. To go to the arrival of a message send, press Ctrl+DOWN, after selecting the message being sent.
Finally, there are navigation options for message reuse relationships. You can go to the original event of a message from the line where it was being reused. In the other direction, you can go to the reused event of a message from the event where it was received. These options are enabled only if they actually make sense for the current selection.
The Eventlog Table uses multiple selection even though most of the user commands require single selection.
For performance reasons, the search ![]() function works
directly on the eventlog file and not the text displayed in the Eventlog Table. It
means that some static text present in Descriptive mode
cannot be found. Usually, it is easier to figure out what to search for in
Raw mode, where the eventlog file's content is directly
displayed. The search can work in both directions, starting from the current
selection, and may be case insensitive. To repeat the last search, use the
Find Next
function works
directly on the eventlog file and not the text displayed in the Eventlog Table. It
means that some static text present in Descriptive mode
cannot be found. Usually, it is easier to figure out what to search for in
Raw mode, where the eventlog file's content is directly
displayed. The search can work in both directions, starting from the current
selection, and may be case insensitive. To repeat the last search, use the
Find Next ![]() command.
command.
For easier navigation, the Eventlog Table supports navigation history. This is accessible from the standard IDE toolbar just like for other kinds of editors. It works by remembering each position where the user stayed more than 3 seconds. The navigation history is temporary and thus it is not saved when the file is closed.
Persistent bookmarks ![]() are also supported and they can
be added from the context menu. A Bookmarked event is highlighted with a different
background color.
are also supported and they can
be added from the context menu. A Bookmarked event is highlighted with a different
background color.
To jump to a bookmark, use the standard Bookmark View (this is possible even after restarting the IDE).
Currently, only the message send lines have tooltips. If message detail recording was configured for the simulation, then a tooltip will show the recorded content of a message send over the corresponding line.
When you open an eventlog file in the Eventlog Table editor, it will automatically open the Sequence Chart View with the same file. If you select an event on the Eventlog Table editor, then the Sequence Chart View will jump to the same event and vice versa. This interconnection makes navigation easier, and you can immediately see the cause and effect relationships of the selected event.