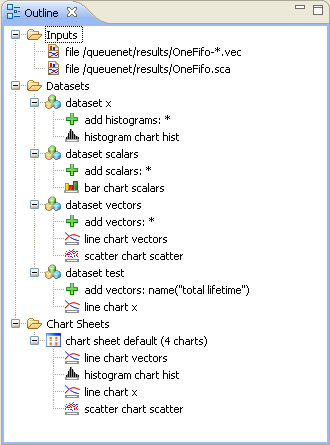
The Outline View shows an overview of the current analysis. Clicking on an element will select the corresponding element in the current editor. Tree editing operations also work in this view.
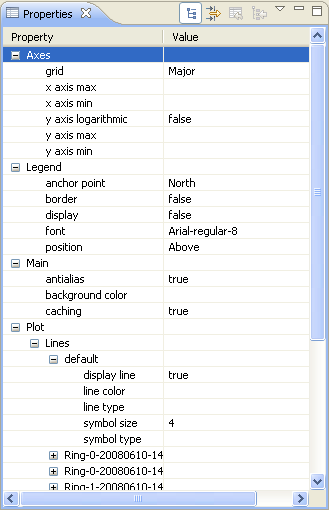
The Properties View displays the properties of the selected dataset, processing node and chart. Font and color properties can be edited as text or by opening dialogs. Text fields that have a bulb on the left side have a content assist; press Ctrl+Space to activate it.
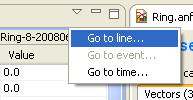
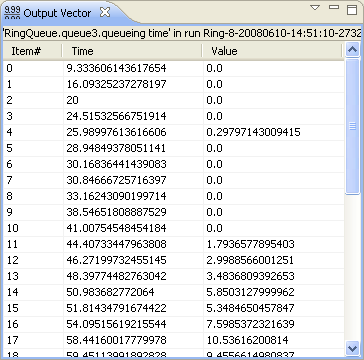
The Output Vector View shows the content of the selected vector. It displays the serial number, simulation time and value of the data points. When event numbers are recorded during the simulation, they are also displayed. Large output files are handled efficiently; only the visible part of the vector is read from the disk. Vectors that are the result of a computation are saved in temporary files.
To navigate to a specific line, use the scroll bar or the menu of the view: